Hide future points in a Calc chart array with the API missing-value indicator
By ON Lab · Sources checked November 8, 2026
For a missing point in a chart's internal numeric array, obtain the missing-value indicator from data.getNotANumber() and verify it with data.isNotANumber(value). Do not reconstruct the indicator from a rounded decimal shown by Basic. In our native Calc test, the displayed strings were identical but only the API-provided value remained a missing point.
A reader updating an internal chart array wanted to hide future weeks in the current-year series without switching to a temporary worksheet. A manually reconstructed tiny number made the line fall towards zero. We tested that same array-based path with an original two-series chart, rather than substituting a cell-range workaround.
Two values can print alike and behave differently
Our native LibreOffice 26.8.2.2 test compared the API indicator with this manually entered expression:
2.2250738585072 * (10 ^ -308)Basic displayed both as 2.2250738585072E-308. The chart's own checker nevertheless distinguished them:
| Value source | isNotANumber before writing | After setData/getData |
|---|---|---|
| Manually entered decimal expression | False | False |
getNotANumber() | True | True |
The decimal display is not a portable recipe for recreating a special value. The official chart API supplies both the getter and the predicate, and specifically directs callers to use the predicate when checking for a missing value. An ordinary equality comparison is not the appropriate replacement.
The actual line-chart outputs
Our original fixture had three sample weeks. The current-year values began as 10, 11 and 12; the comparison series contained 20, 21 and 22. We replaced the current year's third value in two otherwise equivalent internal-data line charts.
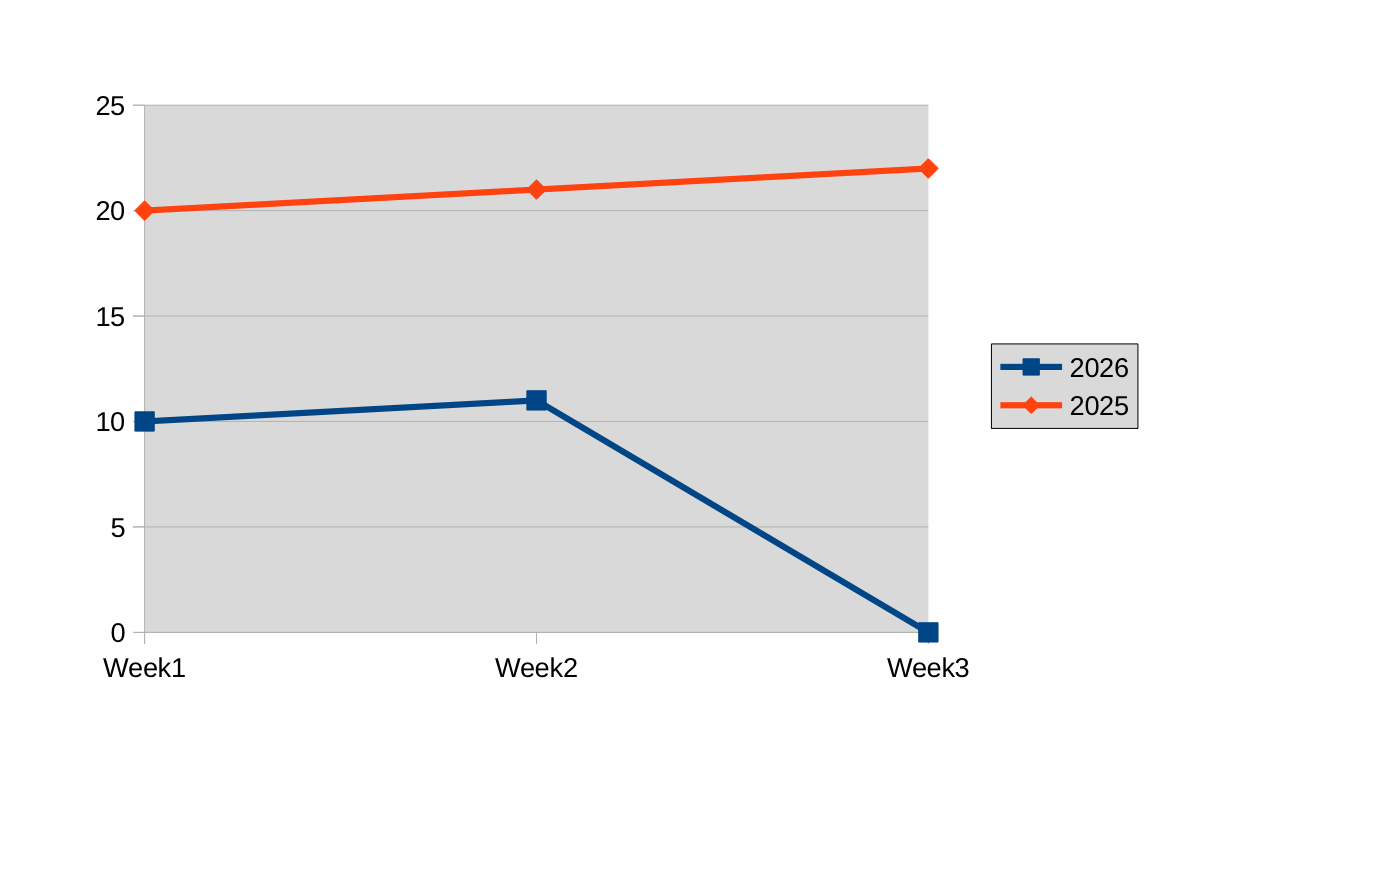
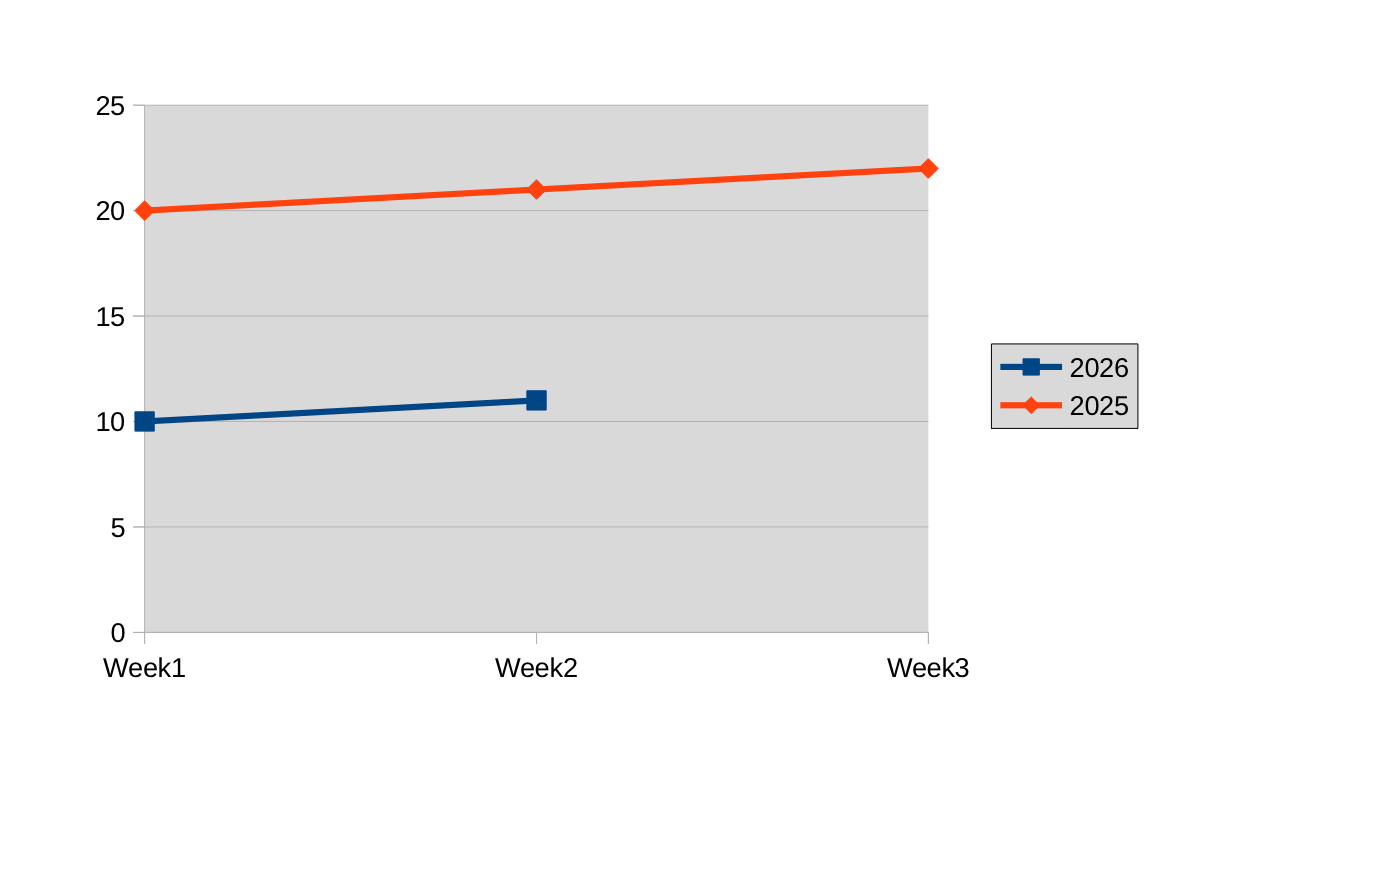
These are our own native Calc PDF exports rendered to PNG, not screenshots of the reader's file or measured cycling statistics. The year labels identify the two example series. We tested on macOS 27.2 arm64 with an internal provider; other chart types and interior-gap policies were not reproduced.
Change the existing matrix using the API value
Starting from the embedded chart document already selected by your macro, the core operation for our three-row sample was:
Dim data As Object
Dim values As Variant
Dim missing As Double

data = chartDocument.Data
values = data.getData()
missing = data.getNotANumber()

values(2)(0) = missing
data.setData(values)

values = data.getData()
Print data.isNotANumber(values(2)(0))
The first index selects the numeric array row and the second the series column. In our fixture, row index 2 was the third sample week, and column index 0 was the current-year series. The native readback printed True after writing the API indicator.
In Calc, the embedded document is available from the selected table chart's EmbeddedObject; its Data object is the interface used above. Keep the internal array path if that is how your chart is built. A separate worksheet range is not necessary to demonstrate this missing-value operation.
Map the future tail before applying a loop
Do not equate a visible week label with an array index without checking the layout. Inspect the array bounds, row descriptions and series descriptions. A chart with header labels or a different starting week can have a different mapping from your worksheet or calendar.
The original reader targeted indices 43 through 50 in one numeric series. Those indices are appropriate only for that actual matrix. Test the first future row and the last future row on a copy, and preserve values in all other series. Our native control retained the comparison series' value 22 and the current series' earlier value 11.
Obtain the indicator from the same chart data object whose matrix you will write. Keep its floating-point value rather than converting it to display text and parsing it back. A zero means a numeric zero; it does not mean “no observation yet.”
Verify readback, output and saved state
- Read the original numeric matrix from the intended embedded chart.
- Replace only the intended future entries using the API indicator.
- Write the matrix and read it back.
- Check the changed entries with isNotANumber and inspect untouched values.
- Render the actual chart and confirm that the tail no longer drops to zero.
- Save a working copy, reopen it and check the same entries again.
Our editable ODS copies retained the distinction after reopening: the API entry was still recognized as missing, while the manually reconstructed number was not. The comparison-series value remained 22. We also wrote the unchanged missing-value matrix back a second time and retained the missing state.
This validates the representation and the trailing-point behavior of the tested line chart. It does not establish a universal missing-data display policy for every chart, nor does it inspect the original 51-row workbook. If readback says missing but a different chart still connects an interior gap, investigate that chart's display behavior separately instead of replacing the indicator with another guessed number.